The research project DEcision system For Irrigation in Crete based on Innovative Technologies – DE.F.I.C.I.T, Code (MIS) 5028242, mainly targeted in the development of an innovative access free system for the highly accurate irrigation of each parcel of land in Crete.
Within the research results are the ones reported in the following publications and are summarized below:
Kritikakis G, Kokinou E, Economou N, Andronikidis N, Brintakis J, Daliakopoulos IN, Kourgialas N, Pavlaki A, Fasarakis G, Markakis N, Soupios P, Manios T, and Vafidis A., 2022, Estimating Soil Clay Content Using an Agrogeophysical and Agrogeological Approach: A Case Study in Chania Plain, Greece, Water, 14(17):2625.
1. Introduction
Globally, agriculture consumes most water resources since farming activities correspond to 70% of global water usage with agricultural use in some developing countries reaching as much as 95% of all uses. Irrigation is inseparable from agricultural output, since the 20% of cultivated land worldwide that is irrigated is also responsible for 40% of global food production.Despite the substantial volume of water resources in Crete, its insufficiency for further agricultural development is an unpleasant reality. Further development of Crete’s agricultural economy under the pressure of increased demand and climate change can only take place under strategic adaptation in all three types of water footprints: green (rainwater taken by plants), blue (surface and groundwater used by irrigation) and gray (freshwater required to assimilate pollutants).
Available water content (AWC) is a critical concept in managing agricultural consumption, since it is a descriptor of the effective storage of water in the soil. The exact determination of water retention characteristics at soil sample level typically involves expensive and time-consuming lab work but can also be predicted using data-driven approaches. To overcome the challenge of spatially explicit assessment of AWC, or the soil properties that control it, various methods have been employed, for example, the use of hyperspectral imaging, microwave backscatter and geophysical methods.
Geophysical methods, assisted by geology, have been widely used in recent decades to improve the understanding of spatial variation in soil moisture content and cation exchange capacity (CEC) of soils.The chargeability (Mn), a quantity determined by induced polarization method, is used in environmental problems studies (i.e., pollutants detection,) and for the identification of the clay composition in geological formations. Consequently, the chargeability is proportional to the accumulation of clay minerals in the soil.
The objectives of the present work are (a) to highlight the effective use of the agrogeophysical and agrogeological methods, along with soil analyses, and to interpret their results qualitatively and quantitatively and (b) to correlate the normalized chargeability of soils with the percentage of the clay content or the sum of the clay and silt content for different geological formations and for different time periods (wet and dry). The proposed method is applied in the plain of Chania in western Crete (Greece).
2. The Study Area
The study area, mainly cultivated with olive, avocado and citrus crops, extends in northwestern Crete covering an area of 182 km2 (Figure 1). It presents a mild geomorphology,while from the geological point of view, is a tectonic basin, created under the intense tectonic influence of normal faults within the neotectonic period.
3. Methodology
3.1. Geological Mapping and Soil Sampling
The terrain model and the geological map were initially aquired. In addition, soil sampling in arable fields took place in 96 sites of the study area located in western Crete (the region of Chania), in both wet and dry periods, aiming to a) characterize the geological nature of the arable soils, b) define the mechanical composition, c) support and further interpret the results of the geophysical survey and d) contribute to the interpretation of the soils hydro-lithological behavior closely related to their texture and physical properties.
3.2. Geophysical Methods
A geophysical survey was conducted at 38 sites within Chania Plain (Figure 1), both in dry and wet periods, based on the geological characterization of the arable soils. We applied electrical resistivity tomography (ERT) and induced polarization (IP, Figure 2) geophysical methods as most appropriate according to the nature and texture of the soils covering the study area.
3.3 Soil Analyses
Soil samples (n=96) were air-dried and sieved. The fraction under 2 mm was subjected tosoil texture analysis and electrical conductivity measurements. The available water content (AWC) [%] was estimated using the R implementation of the ROSETTA model in the 33 kPa to 1500 kPa interval using the sand, silt and clay soil fractions as input. The unpaired Wilcoxon test (Figure 3) was used to compare soil sample groups for significant differences in soil texture, electrical conductivity and AWC.
3.4. Sample Classification
According to the surface geological structure and the expected inherent resistivity, soil samples were classified in three classes (S1, S2 and S3). Class spatial distribution is shown in Figure 1. Τhe classification that was based on geological features, proved more robust than PCA analysis for the subsequent analysis of the geophysical measurements. The proposed classification distinguishes between quartzitic–phylitic (S1) and alluvial parent material (S2)and marls (S3).
3.5 Statistical Analysis
Aiming to correlate the results of the geophysical survey with the mechanical composition of soils, we produced cross-plots ofthe normalized chargeability versus the clay or the sum of the clay and silt soil content (Figure 4).
The dry period data (33 sites) classifications into three classes (S1, S2 and S3) was based on the spatial distribution of the geological formations in the study area.
4. Conclusions
- Agrogeophysical measurements aimed at investigating the clay or the sum of clay and silt soil content in medium-texture soils, such as in the arable fields of the Chania Plain, it is better to carry out the dry period of the year.
- Based on geological classification analysis for the above-mentioned measurements, we distinguished three classes (S1, S2 and S3) for the dry period data. For the first two classes (S1 and S2) associated with phyllites–quartzites, phyllitic–quartzitic conglomerate and breccia, and alluvial deposits, respectively, the estimation of clay or the sum of clay and silt soil content is feasible from measurements of the normalized chargeability.
- The S3 class, geologically related to Pliocene marls, is not statistically correlated to geoelectrical measurements. A denser network of geophysical measurements on Pliocene marls, distributed in the whole year, is required to check if normalized chargeability for clay content evaluation is suitable for Pliocene marls.
- The unpaired Wilcoxon (Figure 3) test showed that classes S1, S2 and S3present slight differences with respect to soil characteristics and theybelong mainly to the medium texture. The sand content, relative to silt and clay contents, clearly prevails in all three classes.
- Soil texture is significantly affected by the agrogeological characteristics in study area.The proposed combination of geophysical and geological approaches may be used to assess clay, the sum of clay and silt and, by extension, the available water contentwith significant detail in depth and scale.
- Specialized geological analyses (such as mineralogical) could assist a more detailed characterization of the arable fields in the study area.
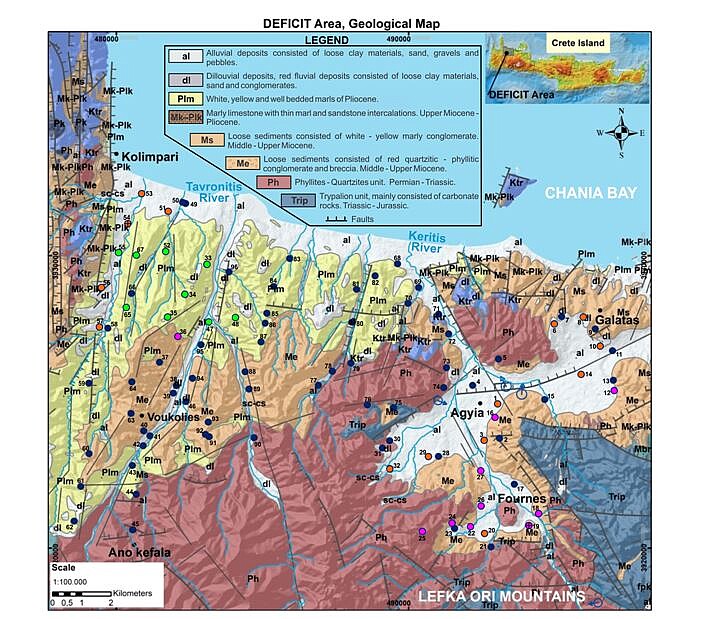
Figure 1. Geological map of the Chania Plain, modified from and references therein, showing the spatial distribution of the 96 sites (colored circles). Class S1 (n=10), S2 (n=14) and S3 (n=9) sites resulting from geological and geophysical classification are indicated with magenta, light brown and green circles, respectively. Control points #19 and #54 are indicated by a cross in the circle.
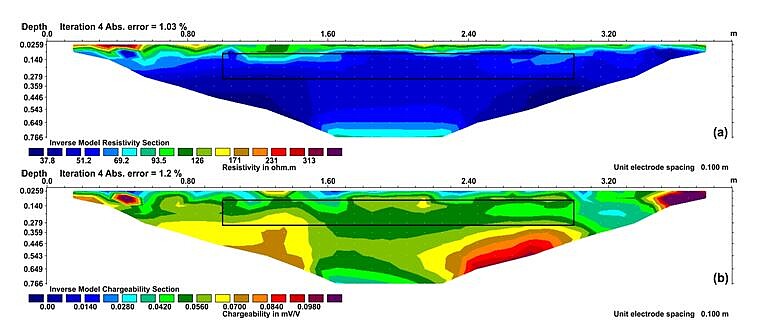
Figure 2. (a) Electrical resistivity section (color scale values in ohm.m) and (b) normalized chargeability section (color scale values in mV/V) from site #33, acquired during the wet period. The black rectangle on the sections indicates the effective area of data used to evaluate the mean, median and average values from each section.
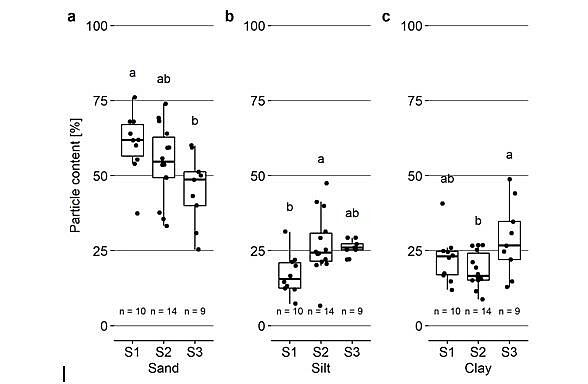
Figure 3. Distribution of (a) sand, (b) silt and (c) clay content [%] in classes S1, S2 and S3.
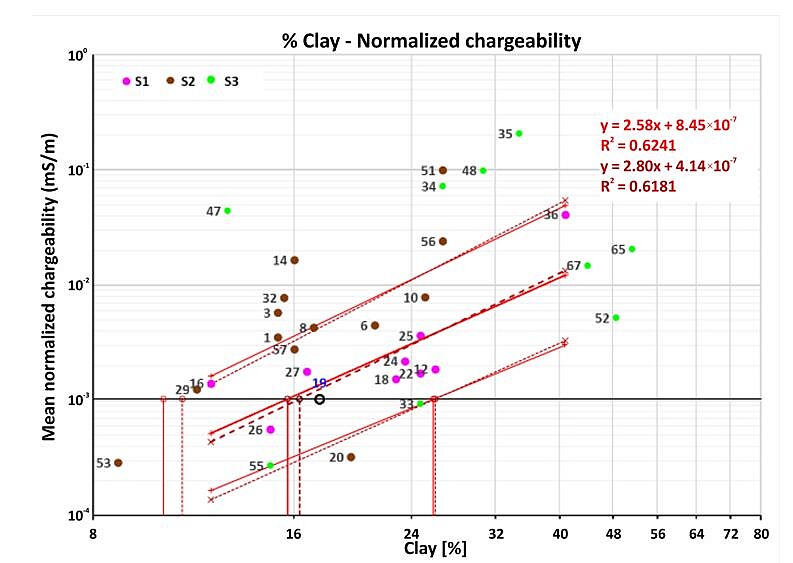
Figure 4. Clay (%) versus Mn (mS/m) log–log diagrams with the data from the 33 sites surveyed during the dry period. Red solid and dark red dashed slanted lines correspond to the OLS and WLS linear regression, respectively. The evaluation of the clay content (vertical solid and dashed lines) from the Mn value for site #19 (black circle) using the S1 dataset, is presented.
Economou, N., Brintakis, J., Andronikidis, N., Kritikakis, G., Kokkinou, E., Papadopoulos, N., Kourgialas, N., and Vafidis, A., 2021, GPR data migration velocity model estimation using a local diffraction multi-focusing criterion, 11th Congress of the Balkan Geophysical Society, Bucharest, Romania. Best presentation award.
Summary
This paper describes the usage of constant velocity migration of Ground Penetrating radar (GPR) sections over a predefined range of migration velocities for the validation of diffraction focusing, using local slopes distribution, with the scope to estimate a migration velocity model. The methodology avoids the user dependent diffraction analysis to circumvent subjectivity and uses overlapping x-t windows to retrieve diffraction focusing validation for the entire dataset. The estimated migration velocity is utilized as an attribute whose sensitivity in water variation saturation is tested as a complementary method to the Electrical Resistivity Tomography (ERT) method for the assessment of soil moisture.
The proposed methodology involves the following processing steps:
-
Constant-velocity time migration of the GPR data using a range of velocity values between 0.04m/ns and 0.24 m/ns with 0.005 m/ns step.
-
Estimation of local slopes sections for each constant velocity time migrated section.
-
Estimation of the SD values of local slopes within the x-v-t cube in x-t windows for each migration velocity value.
-
Assignment of the highest inverse SD value for each x-t window to the corresponding migration velocity.
-
Migration velocity image generation whose axes denote the window coordinates (e.g. x-t coordinates of its center).
Examples
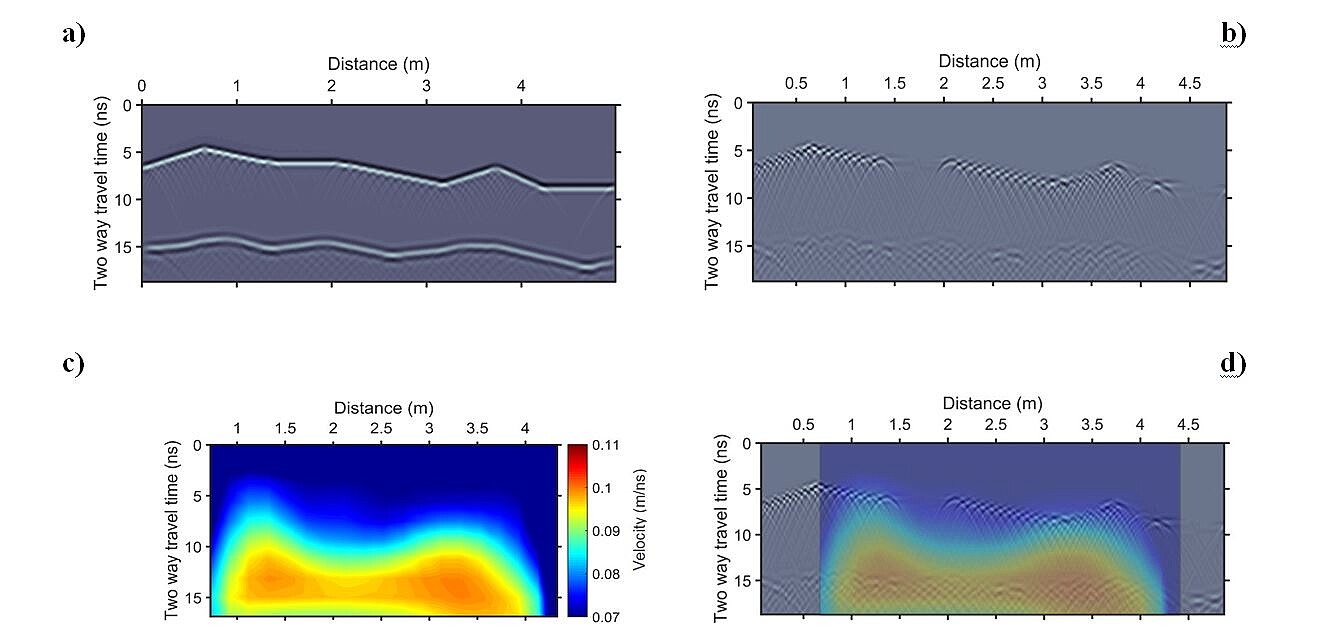
Figure 1. Migration velocity estimation. a) Synthetic dataset, b) is (a) after PWD, c) is the estimated migration velocity image and d) is (c) superimposed on (b).
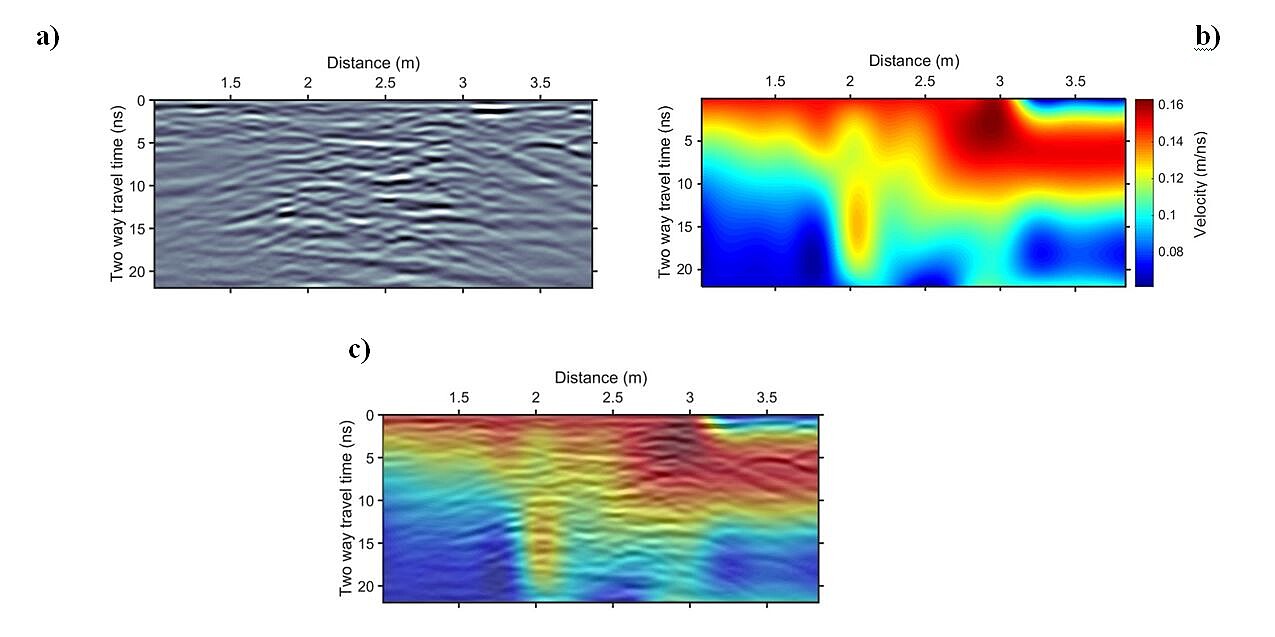
Figure 2. Migration velocity estimation over a real GPR dataset. a) The GPR section after conventional processing, b) the derived migration velocity image for (a) and c) is the superimposition of (b) over (a).
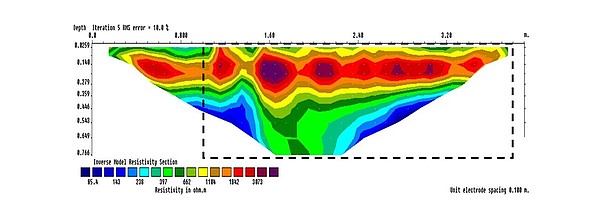
Figure 3. Electrical resistivity section using the Gradient array and 0.1m electrodes spacing. Vertical axis is depth in m and horizontal axis is electrode location in m.
Conclusions
This work is about the proposal of a method for the estimation of a migration velocity from GPR data, which uses the local slopes distribution as a x-t window attribute sensitive to diffraction focusing. It requires constant velocity migrations over a predefined velocity range with 0.005 m/ns step. This methodology can be used as a complementary method to ERT for the assessment of soil moisture.